
Definition
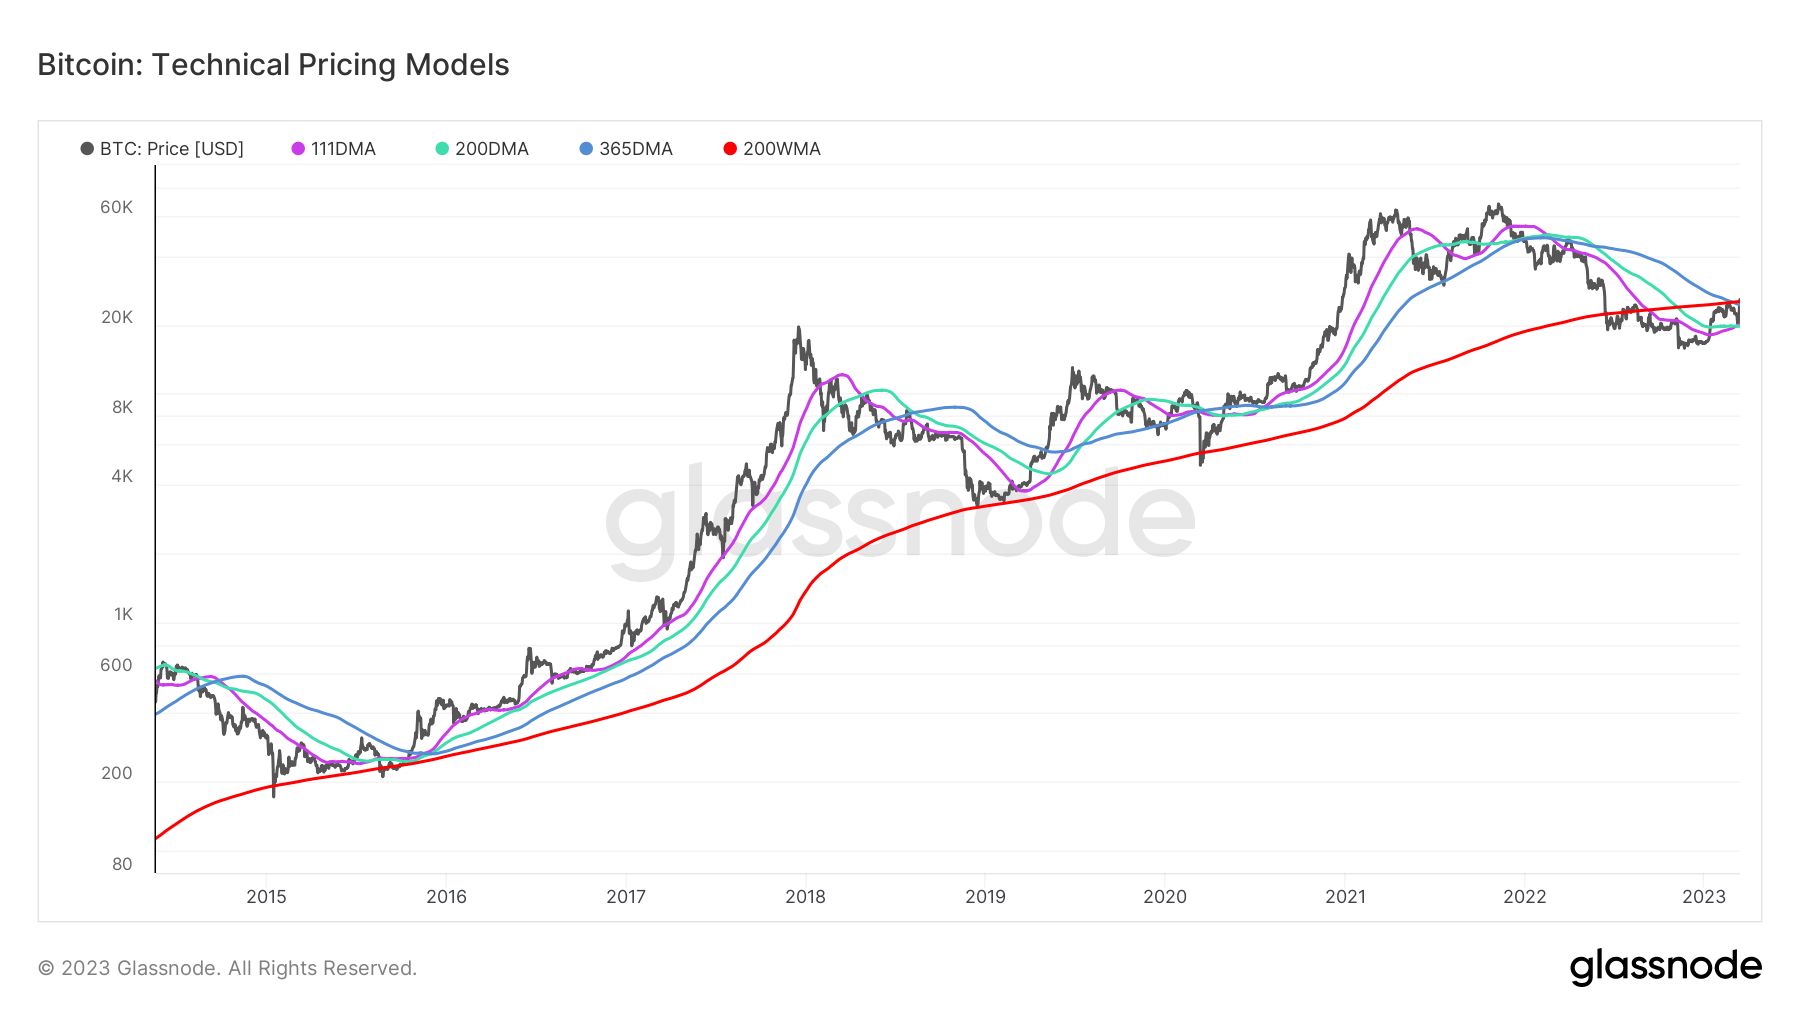
- The 200 Week Moving Average (200W-SMA)
 The 200 Week Simple Moving Average provides a tool capturing the baseline momentum of a classic 4 year Bitcoin Cycle.
 - Yearly Moving Average (365D-SMA)
 The 365 Day Simple Moving Average provides a long standing baseline for high time-frame market momentum.
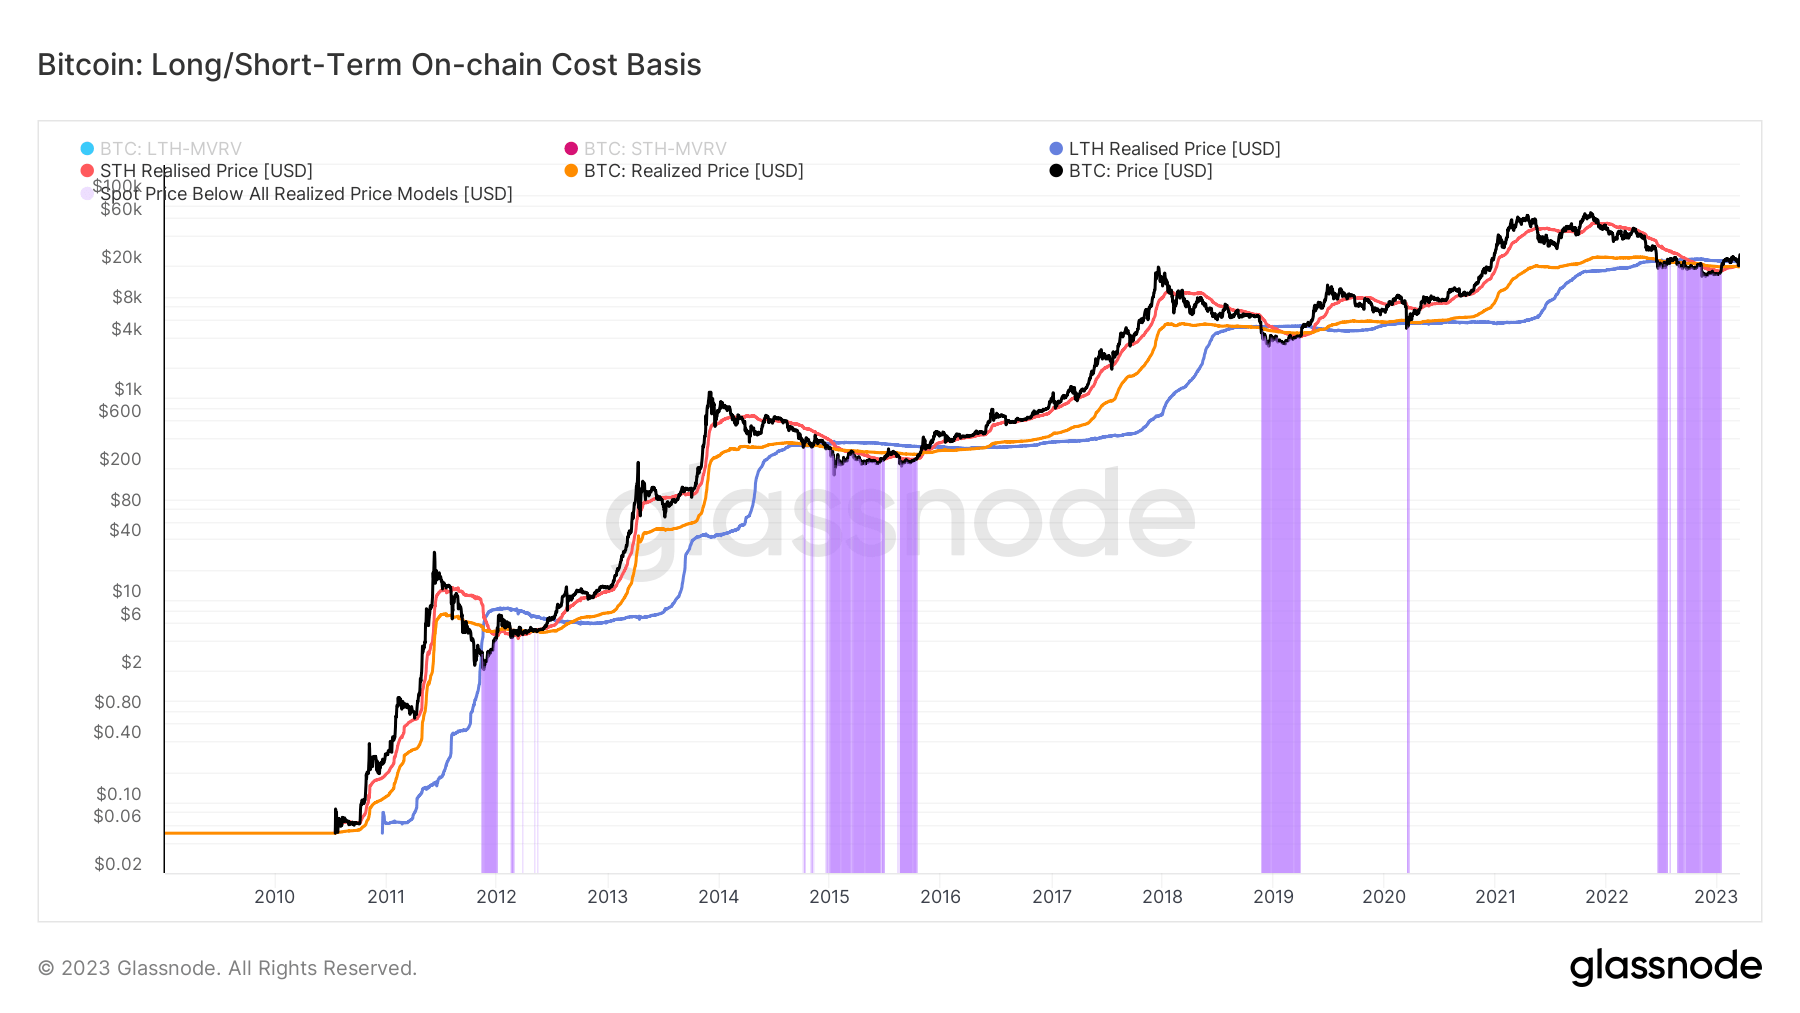
 - Long-Term Holder Realized Price reflects the average on-chain acquisition price for coins held outside exchange reserves, which have not moved within the last 155-days. These reflect the least probable coins to be spent on any given day.
Quick Take
- Bitcoin surpasses $26,000 and, on the way, broke multiple resistance levels.
- The 200 WMA was at $25,277.
- The 365 DMA was at $24,448.
- Long-term holder realized price at $21,958.
The post Bitcoin breaks multiple key resistance levels on path to $26K appeared first on CryptoSlate.