
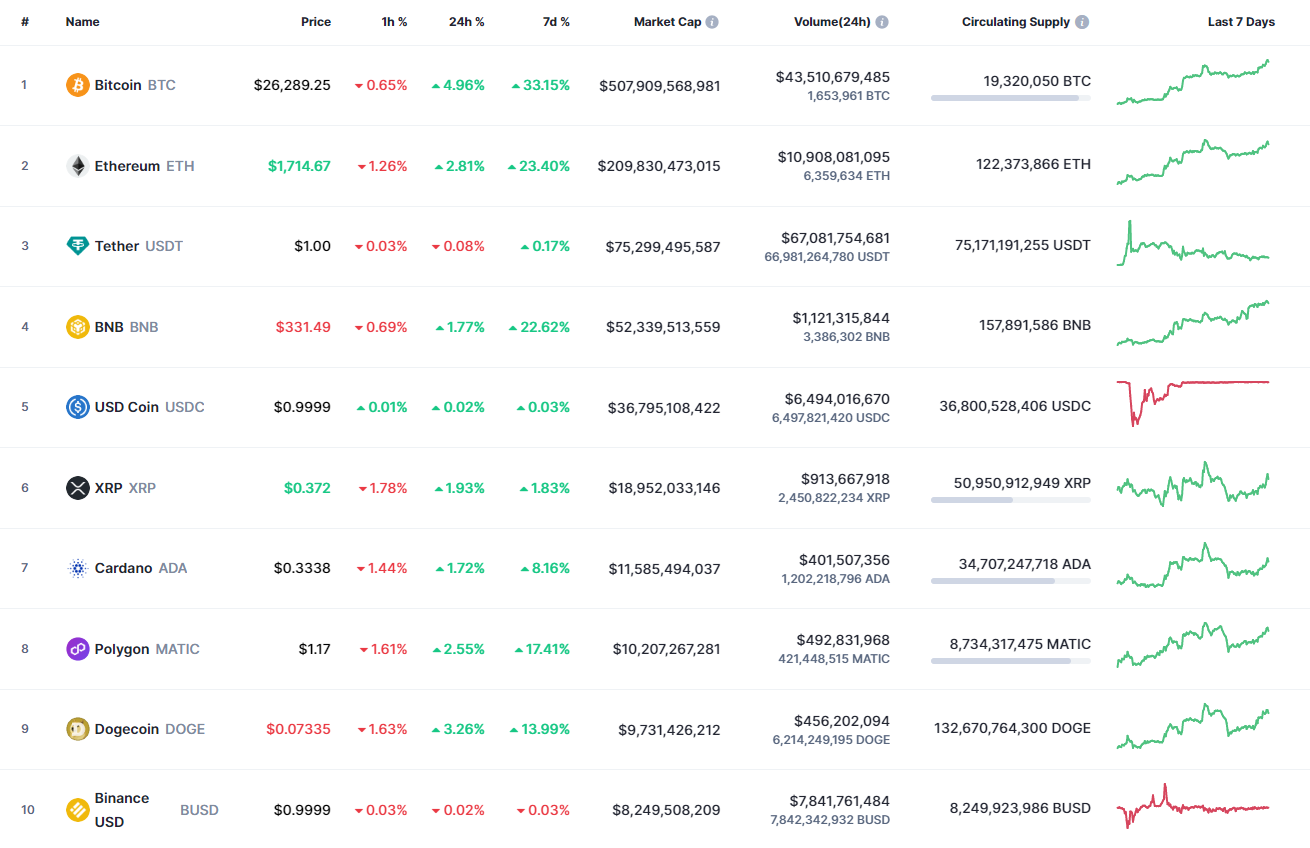
Bulls have seized the initiative again as most of the coins are in the green zone.
BTC/USD
The rate of Bitcoin (BTC) has increased by 5.10% over the last 24 hours.
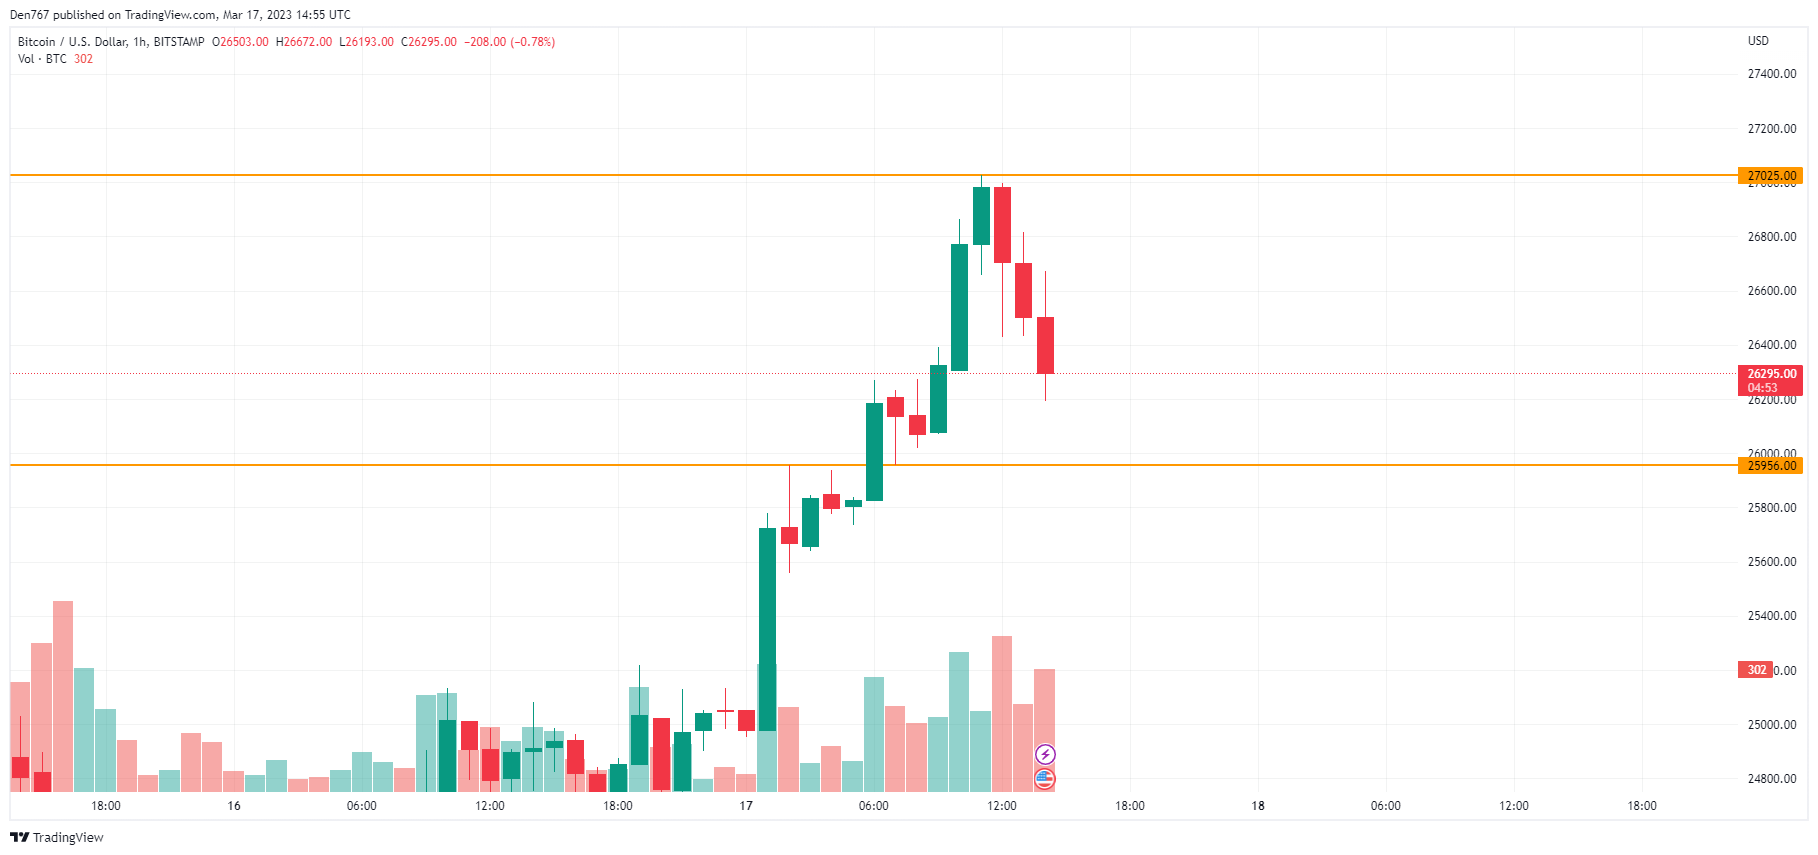
On the hourly chart, the price of Bitcoin (BTC) has broken the local support level at $25,956. At the moment, the rate is trading in the middle of a narrow range, accumulating power for a further move.
There are low chances to see either growth or decline today as most of the ATR has been passed. In this case, the more likely scenario is ongoing sideways trading in the area of $26,000-$26,500.
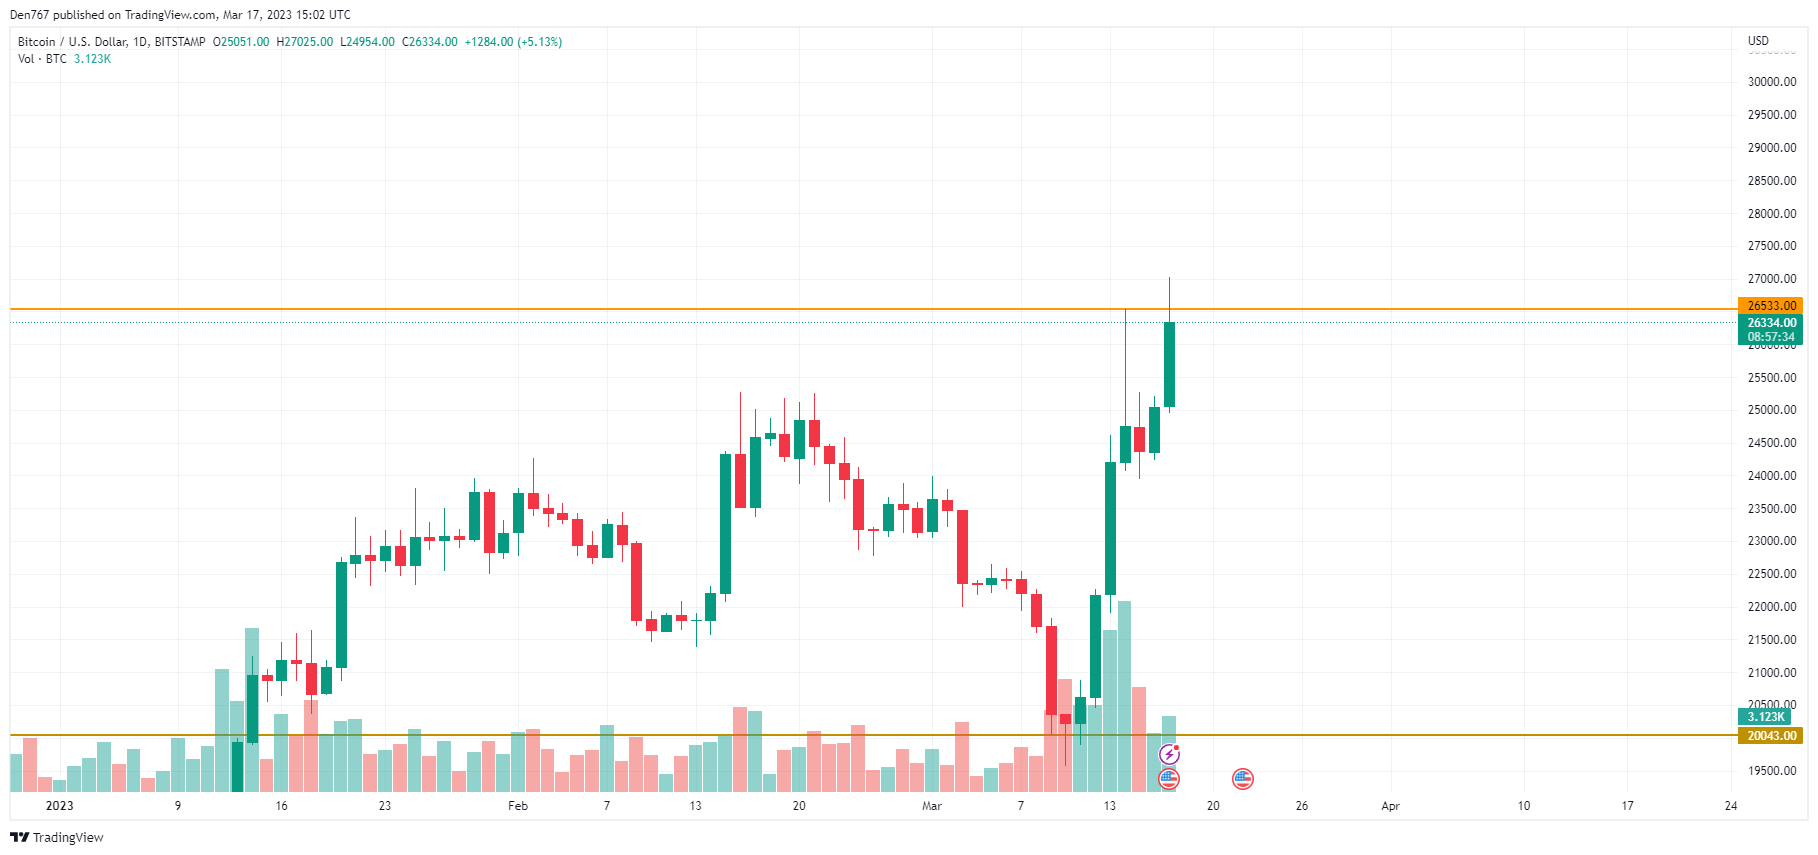
On the daily time frame, traders should pay attention to the nearest resistance at $26,533. If the candle closes near it, growth may continue to the $27,000 mark and above tomorrow.
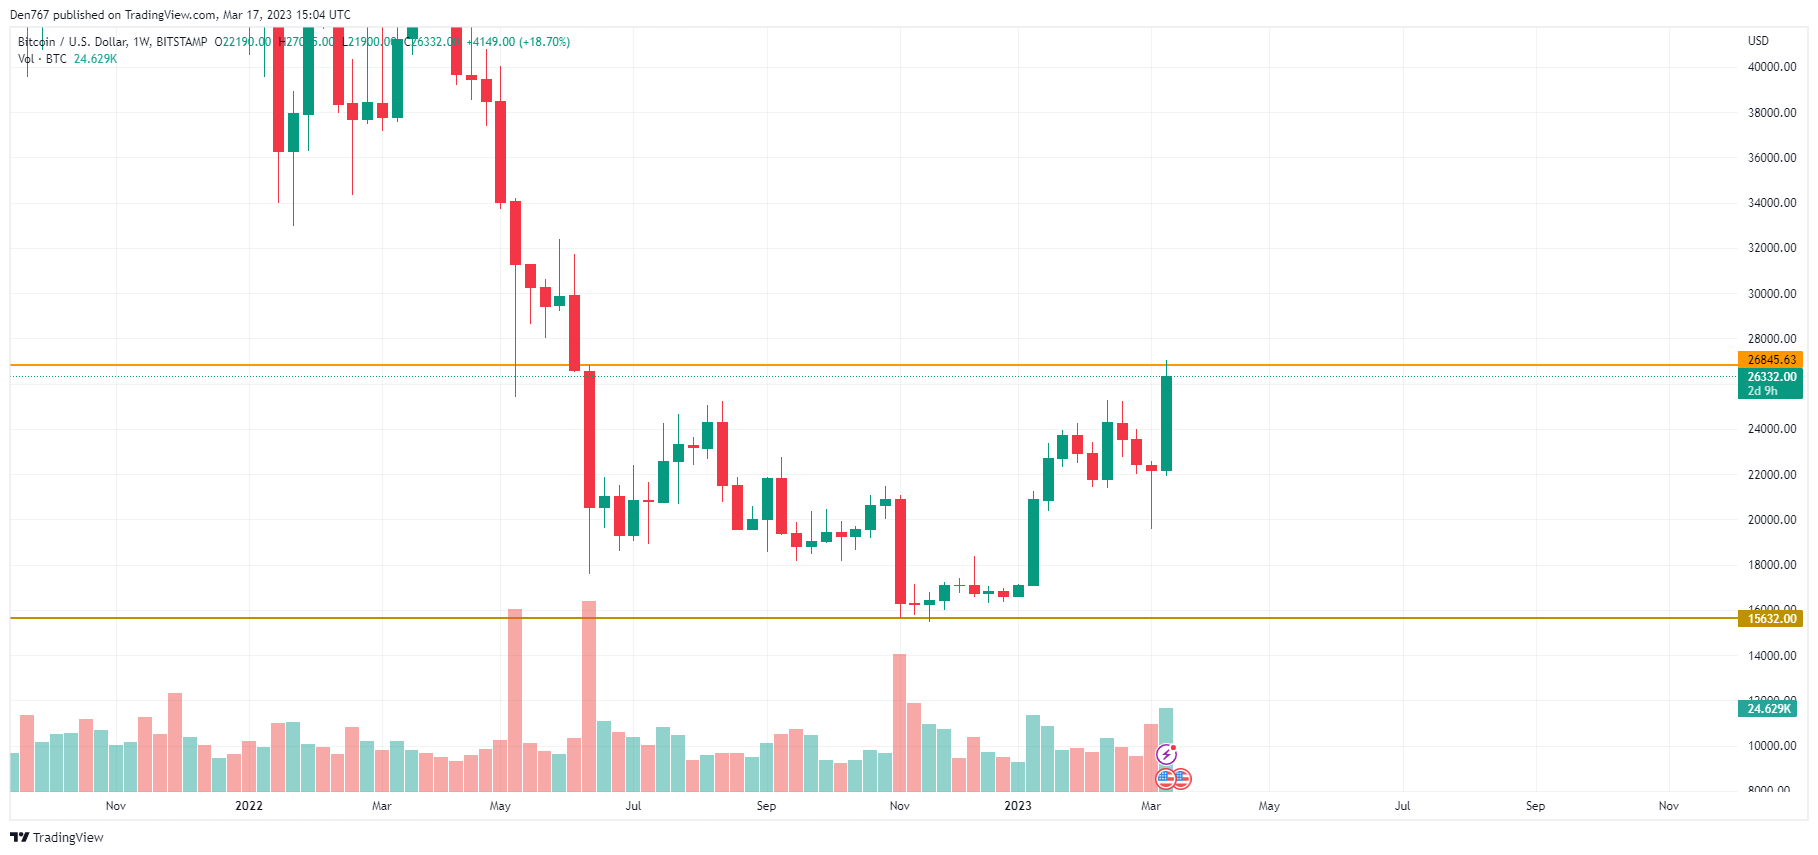
From the midterm point of view, the price of Bitcoin (BTC) has approached the resistance at $26,845. If the bar closes with no long wicks, the accumulated energy might be enough for a blast to the $28,000-$30,000 zone.
Bitcoin is trading at $26,351 at press time.