
On-chain data shows the Bitcoin profit-taking volume has shot up after the cryptocurrency’s price briefly broke above the $27,000 level.
Bitcoin Observes 2.4 Times As Many Profit Transfers As Loss Ones
According to data from the on-chain analytics firm Santiment, this profit-taking level has not been seen since December 2020. The relevant indicator here is the “ratio of daily on-chain transaction volume in profit to loss,” As its name already suggests, it measures the ratio between the Bitcoin volume of profit-taking transactions and that of loss-taking ones.
This metric tells us whether there is more profit harvesting in the market than loss realization or not right now. The indicator has a positive value if the profit volume is higher. Otherwise, it’s negative.
The indicator works by going through the on-chain history of each coin being sold/transferred to see the price at which it was last moved. If this previous selling price for any coin was less than the BTC value right now, then this particular coin moved at a profit, and thus, its transaction is counted under the profit volume. Similarly, if the last price exceeds the latest value, the coin’s sale contributes to the lost volume.
Now, here is a chart that shows the trend in the ratio of daily on-chain transaction volume in profit to a loss for Bitcoin, as well as for Ethereum, over the past year:
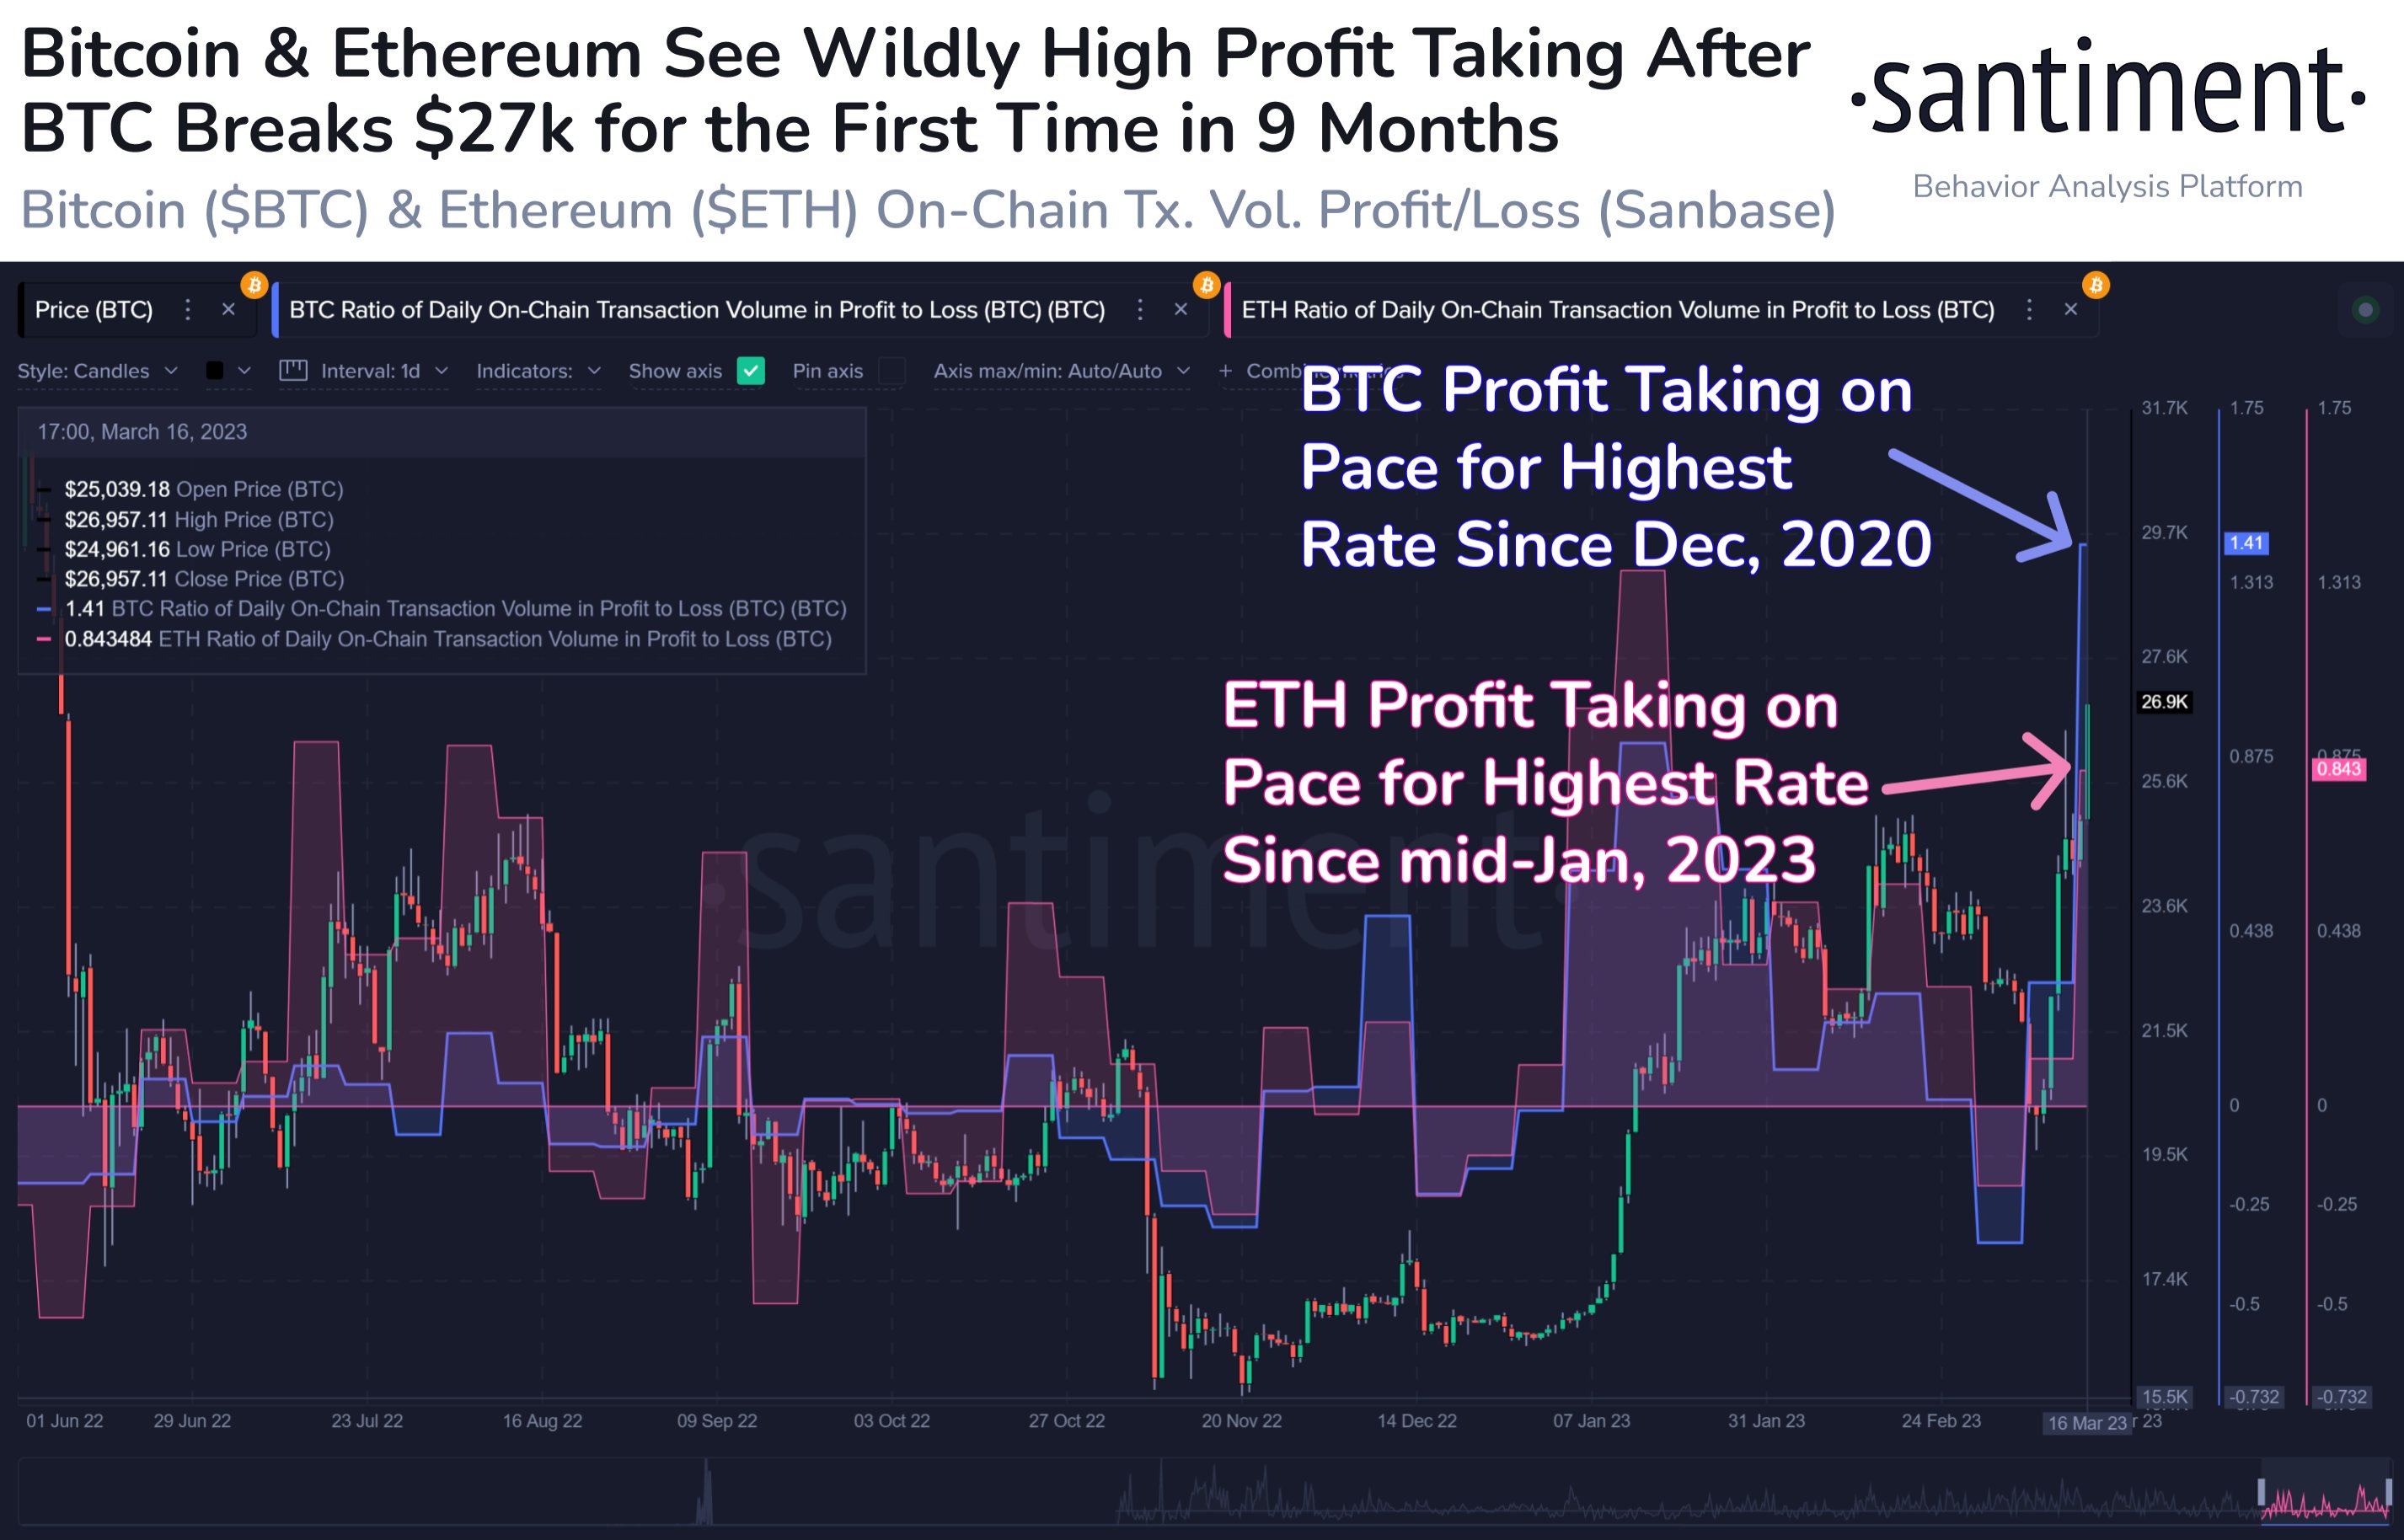
The values of the two metrics seem to have been relatively high in recent days | Source: Santiment on Twitter
The above graph shows that the Bitcoin profit-to-loss volume ratio has been entirely elevated in the last few days. With the latest surge in the price above the $27,000 level (which only lasted briefly before the coin fell back under the mark), the indicator has seen an even sharper spike.
In this surge, the metric has attained a value of about 1.4, suggesting that the profit-taking transaction volume is around 2.4 times more than the loss-taking one. This indicator level is the highest since December 2020, when the 2021 bull run was in its initial stages.
This high-profit volume would suggest that investors fear drops right now, and hence, they rushed to harvest some profits as soon as the price broke above the $27,000 level. The selling pressure from these profit-takers was likely behind the pullback to the $26,000 level.
The chart shows that Ethereum’s profit-taking volume has also risen significantly in the last few days. Still, the cryptocurrency is only observing the highest value of the indicator since the middle of 2023, and only a bit further back than is the case for Bitcoin.
BTC Price
At the time of writing, Bitcoin is trading around $26,800, up 34% in the last week.
It looks like the value of the asset has shot up over the past 24 hours | Source: BTCUSD on TradingView
Featured image from Kanchanara on Unsplash.com, charts from TradingView.com, Santiment.net