Bulls remain more powerful than bears as the prices of coins are rising.
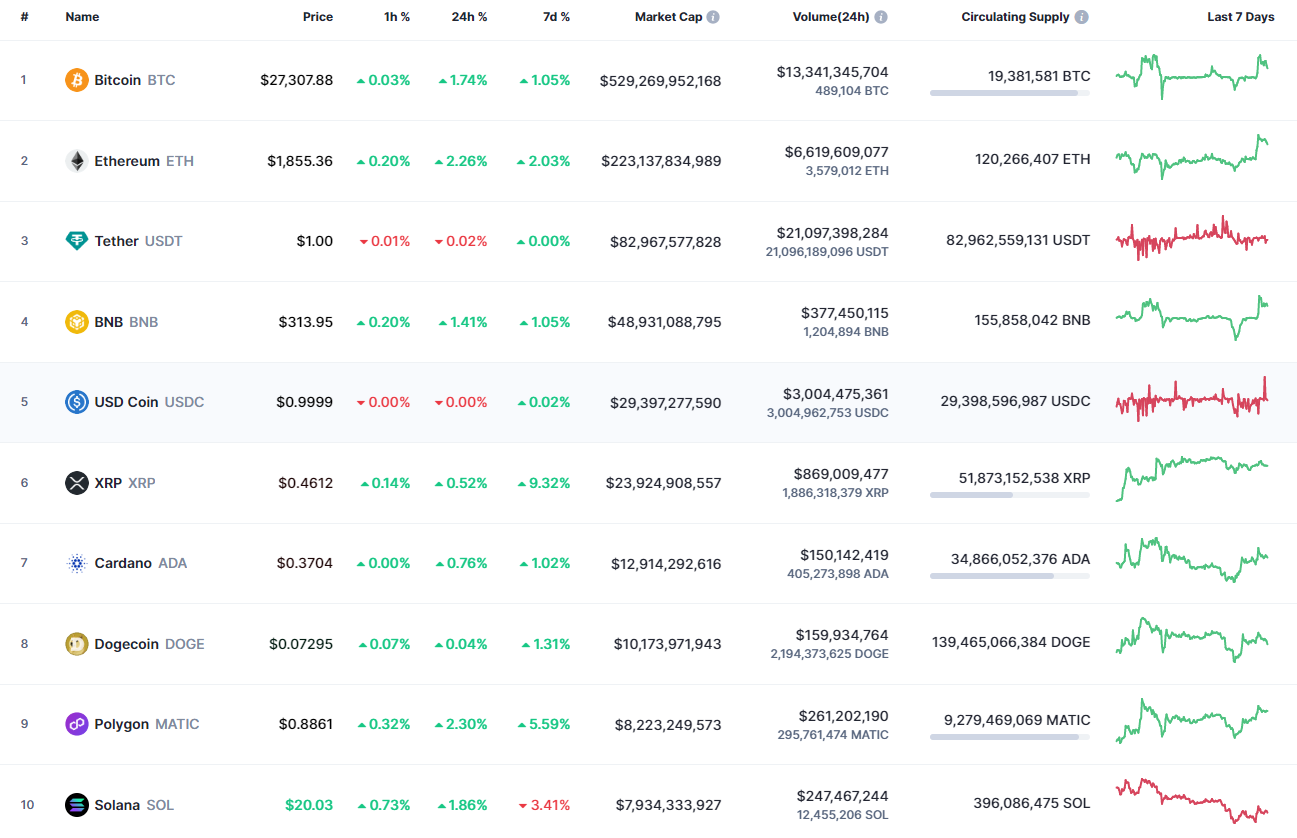
Top coins by CoinMarketCap
SHIB/USD
SHIB has followed the rise of other coins, rising by 1.74%.
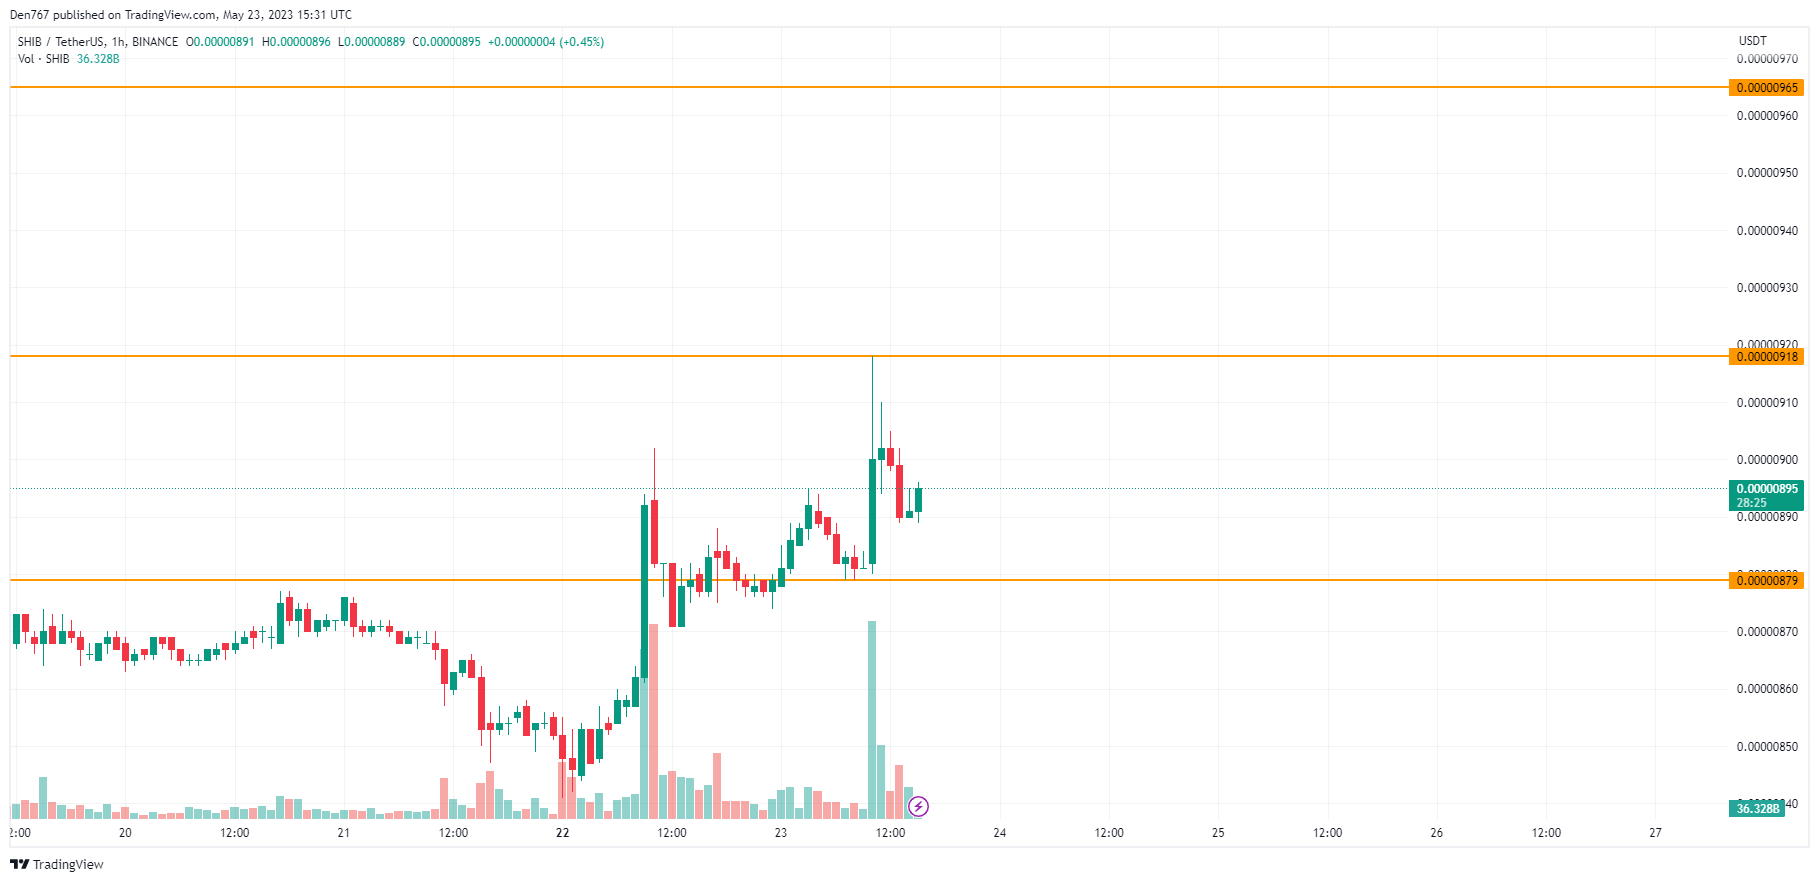
Image by TradingView
On the local time frame, the rate of SHIB has bounced off the support at $0.00000879. However, it is too early to think about buyers’ dominance. It may happen only if the upward move continues to the interim mark of $0.000009 and fixes above it. Only in that case, there is a chance to see a test of the resistance at $0.00000918.
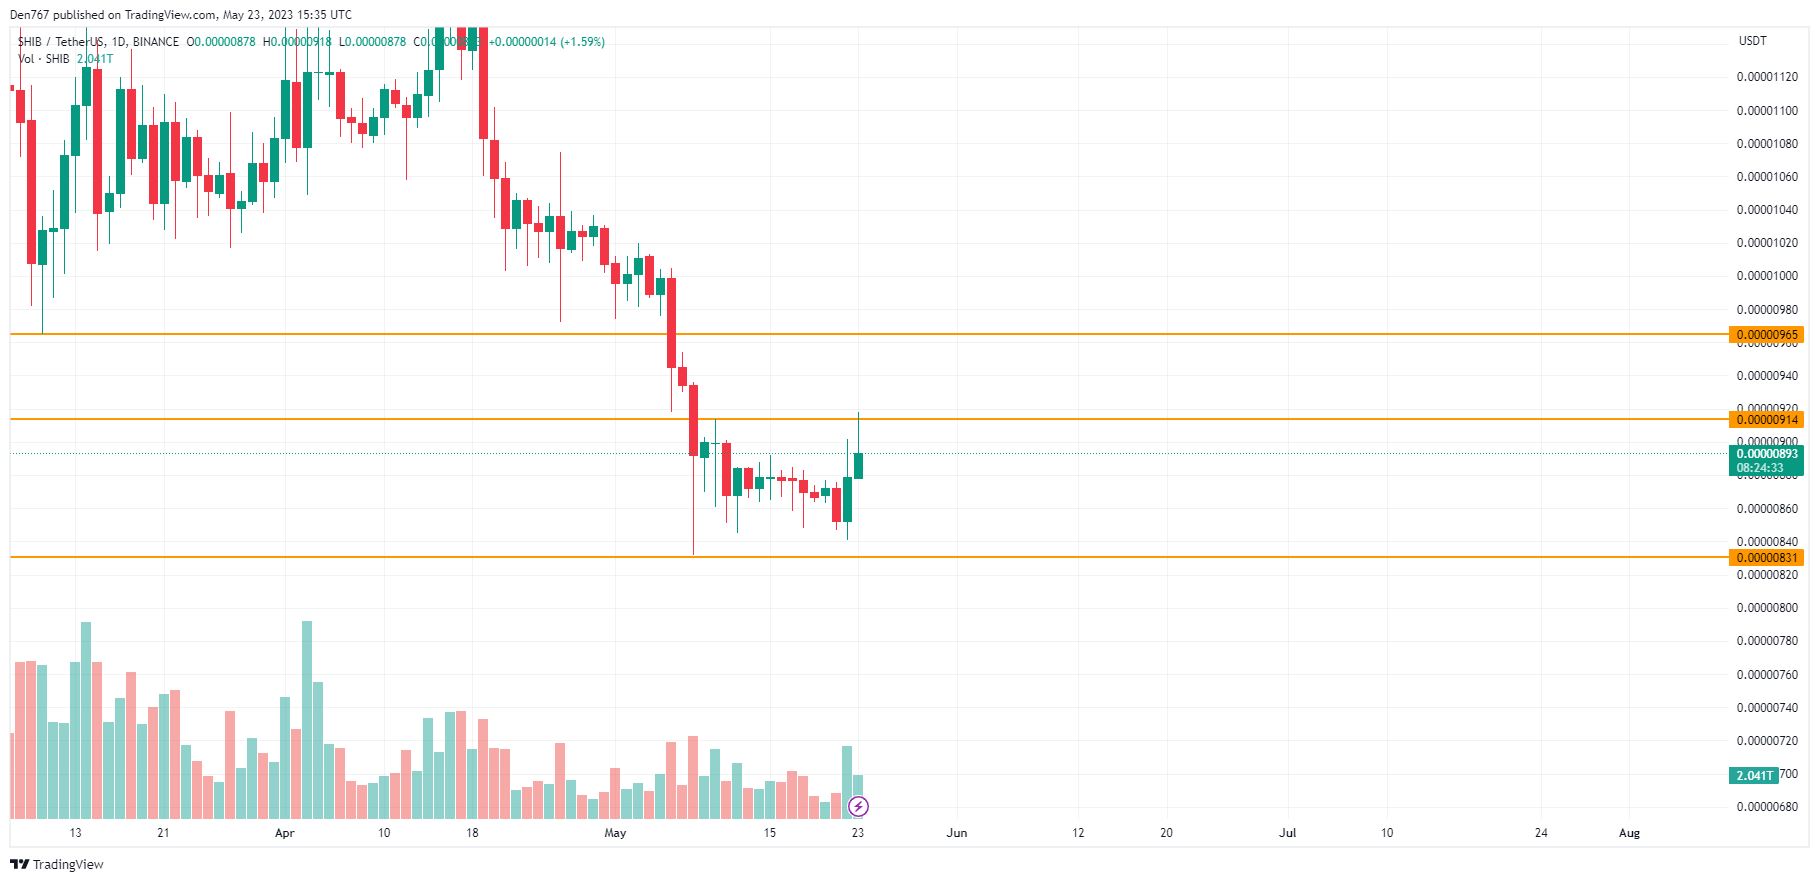
Image by TradingView
On the daily chart, the price of SHIB has made a false breakout of the mirror level at $0.00000914, which serves as resistance. If the daily bar closes far from it and below yesterday’s peak at $0.00000902, the correction may lead to the test of the $0.00000880 zone.
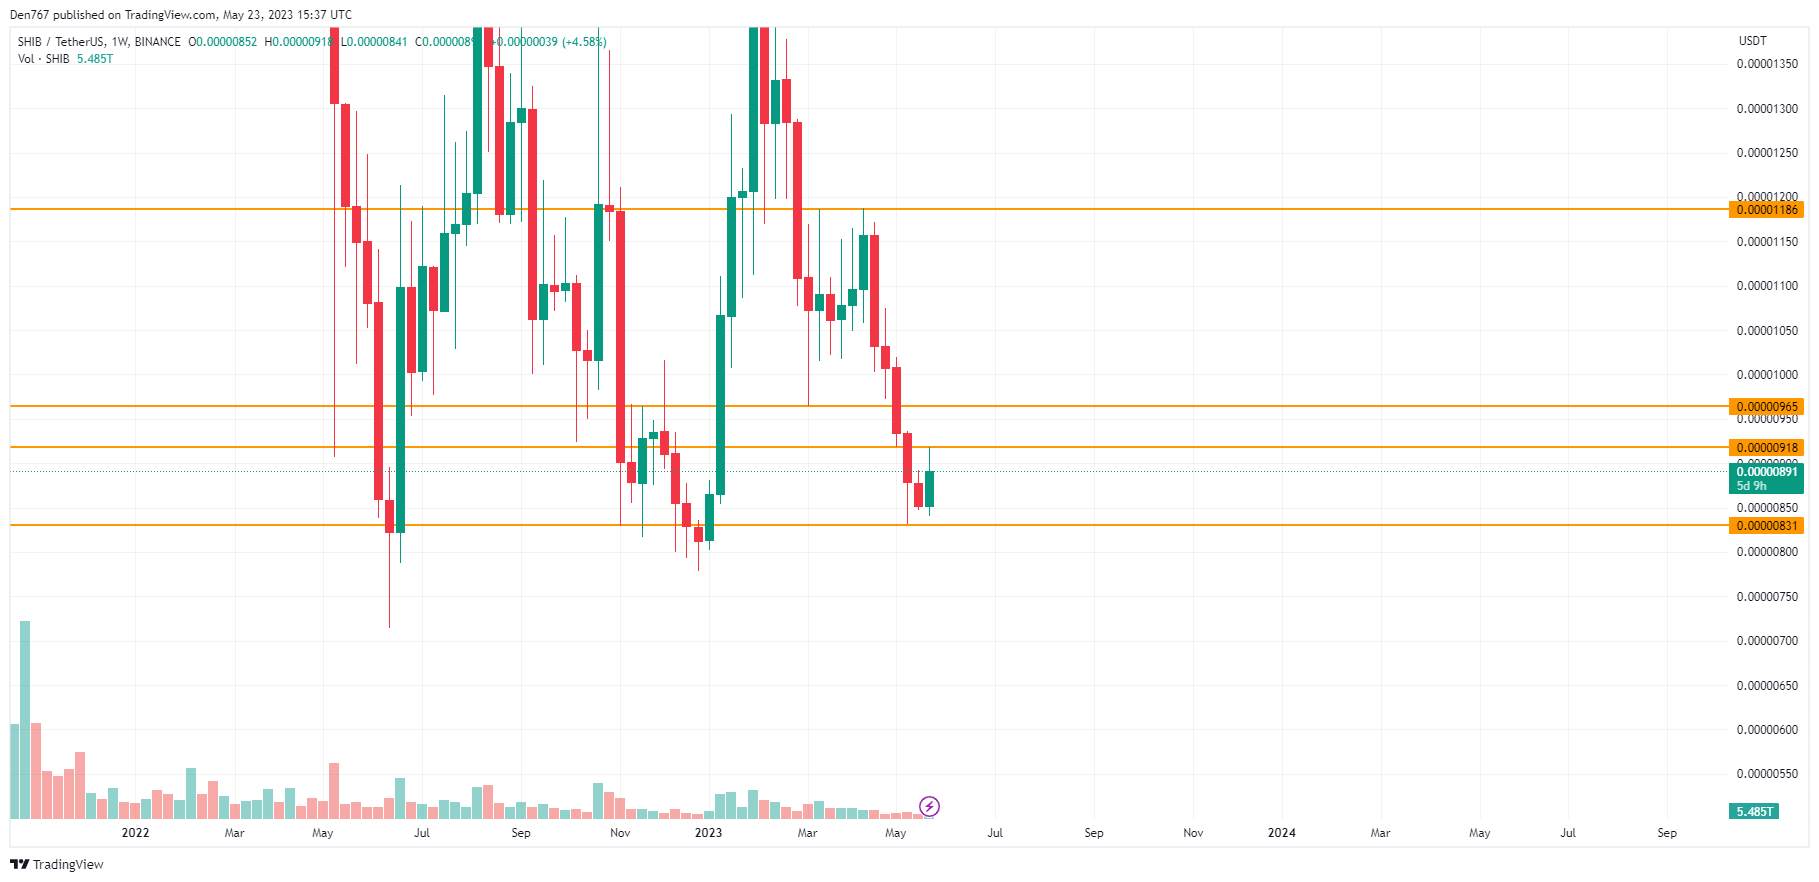
A similar case can be seen from the midterm point of view; however, here, one should pay attention to the candle closure. If it occurs above the $0.00000892 level, buyers might seize the initiative and return the rate to the $0.00000950 area.
SHIB is trading at $0.00000891 at press time.