Ripple’s price has been declining over the last few weeks, with two significant moving average lines broken to the downside. The price could drop deeper in the coming days, as things are not looking good from a technical analysis aspect.
Technical Analysis
By: Edris
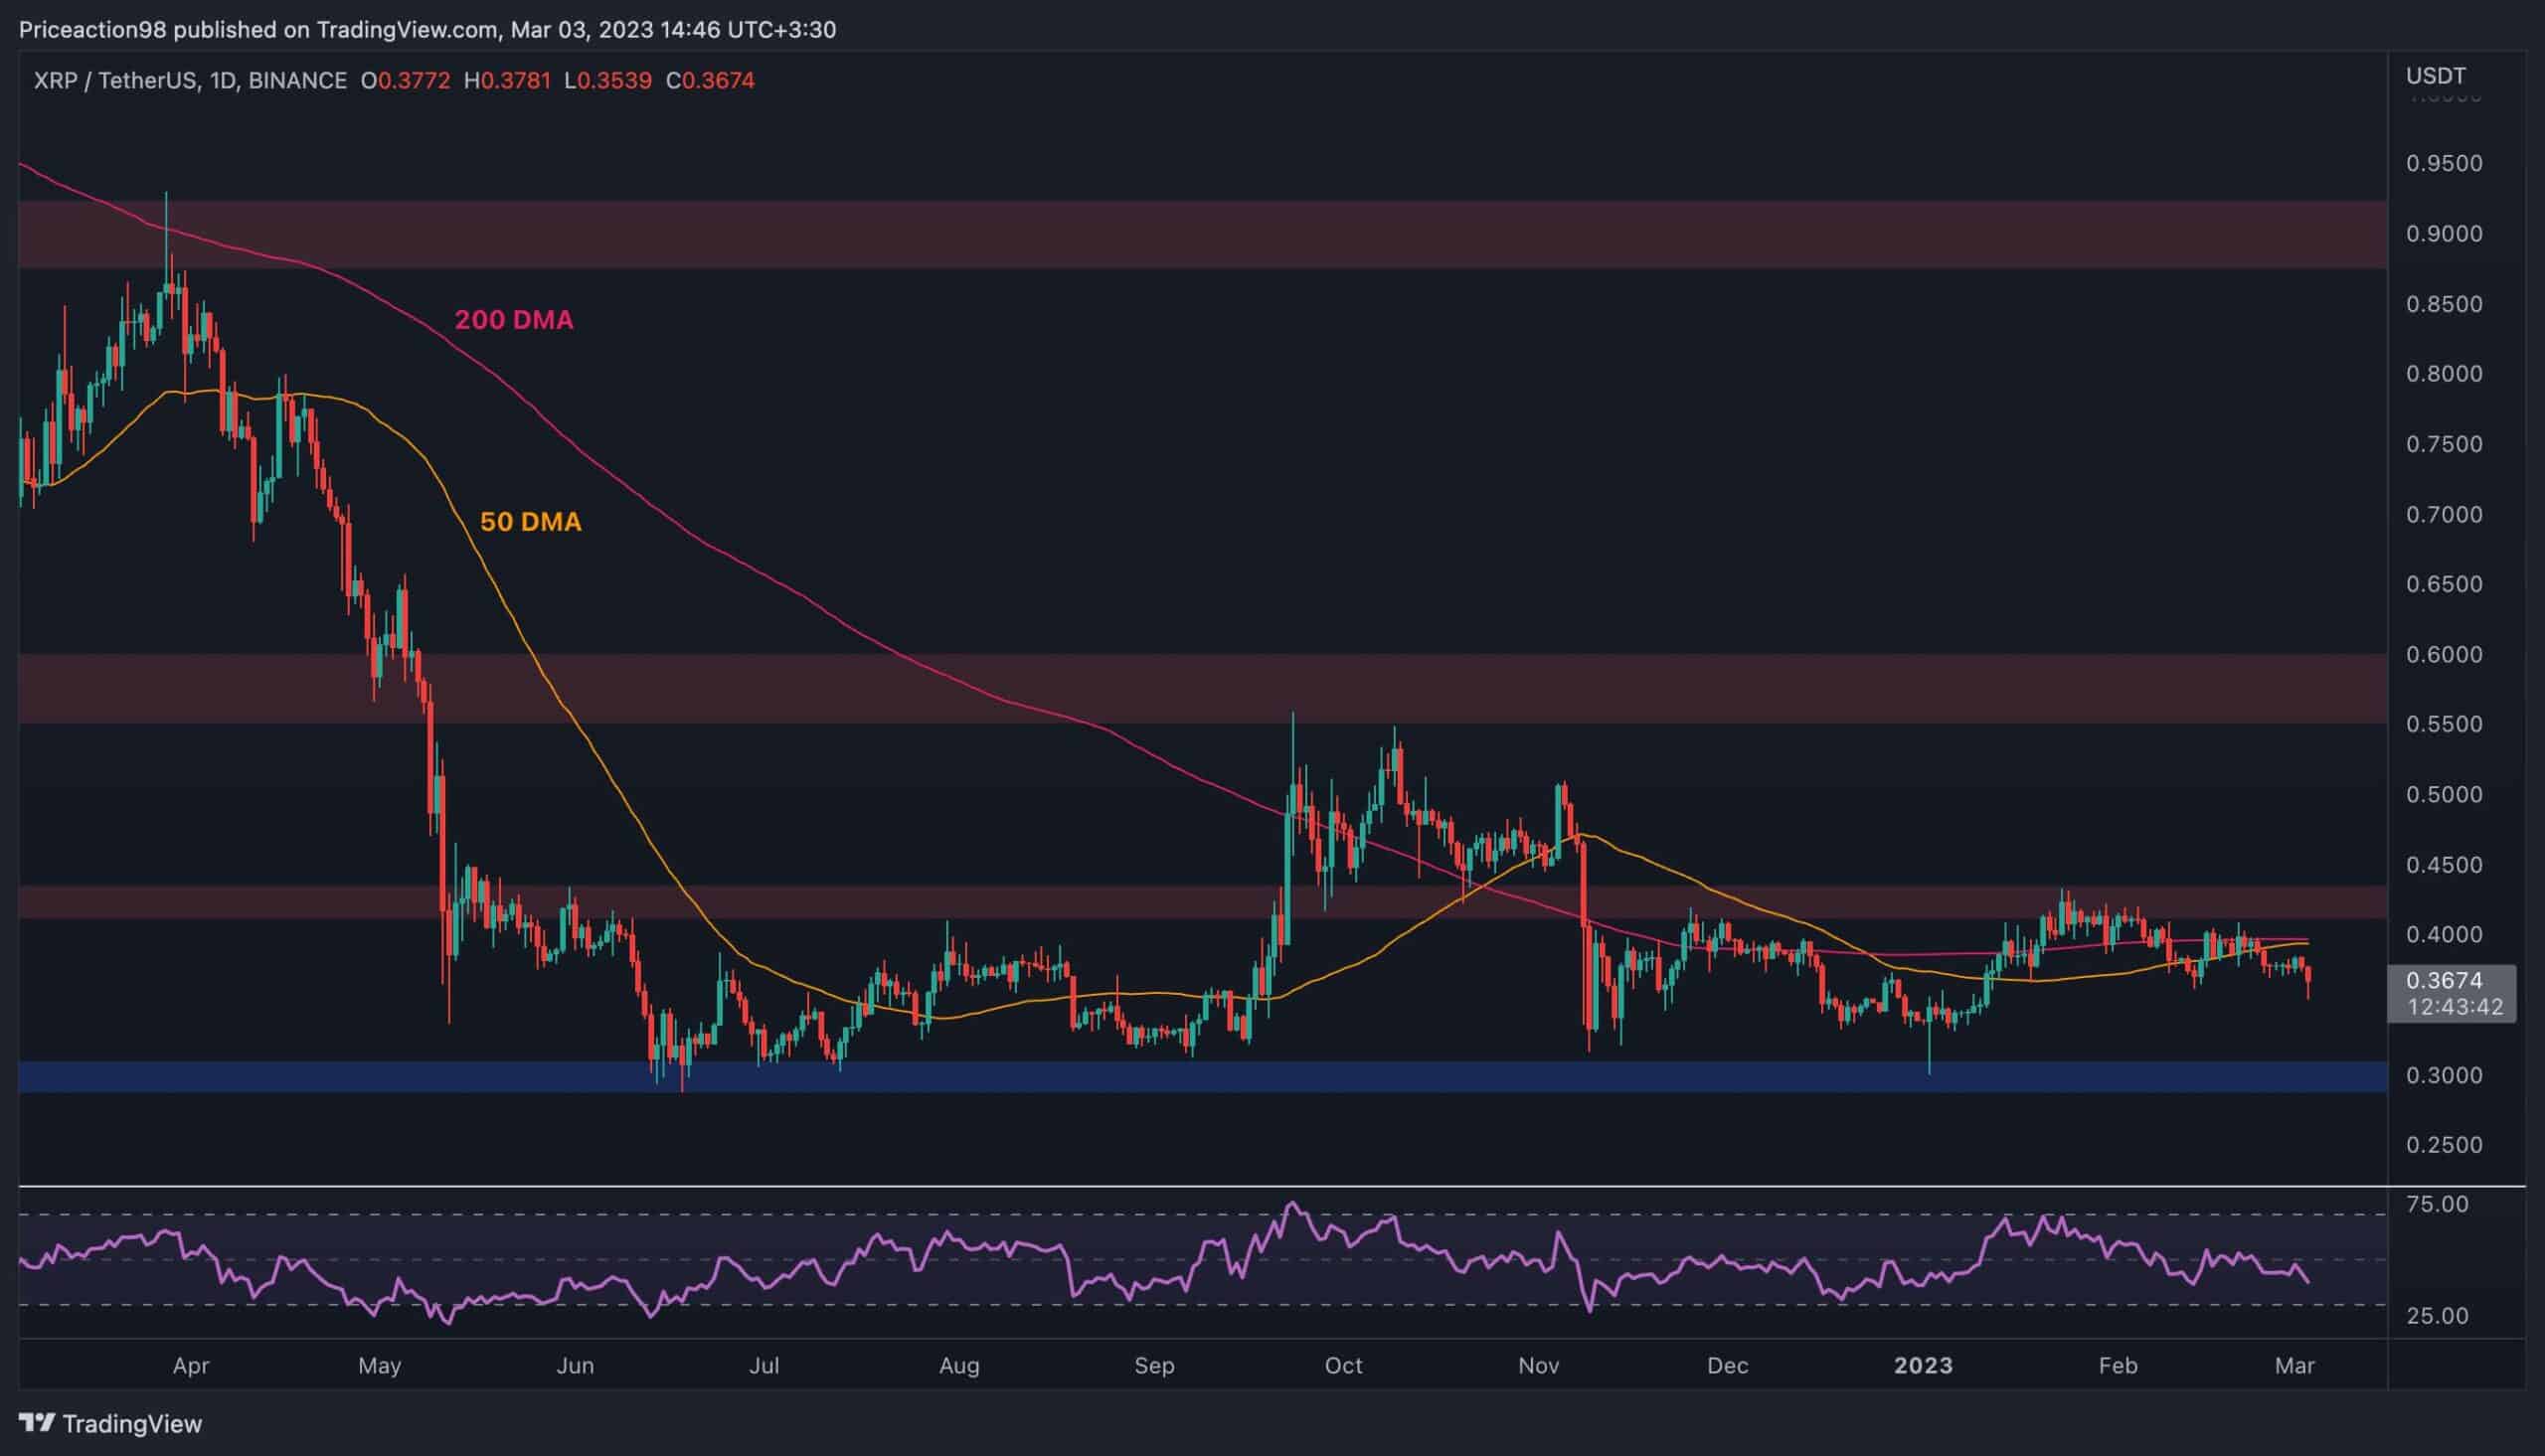
XRP/USDT Daily Chart
Looking at the USDT chart, the price has been rejected from the significant $0.43 area and has broken both the 50-day and 200-day moving average lines to the downside, which are both located around the $0.4 level.
Currently, the market is showing a high willingness to drop toward the key $0.3 level, where the current bear market’s lowest low sits. Therefore, a breakdown of this area would be disastrous for buyers, as it would further elongate the bear market.
The RSI indicator has also dropped below the 50% threshold, demonstrating the current bearish momentum and boosting the likelihood of a deeper decline in the short term.

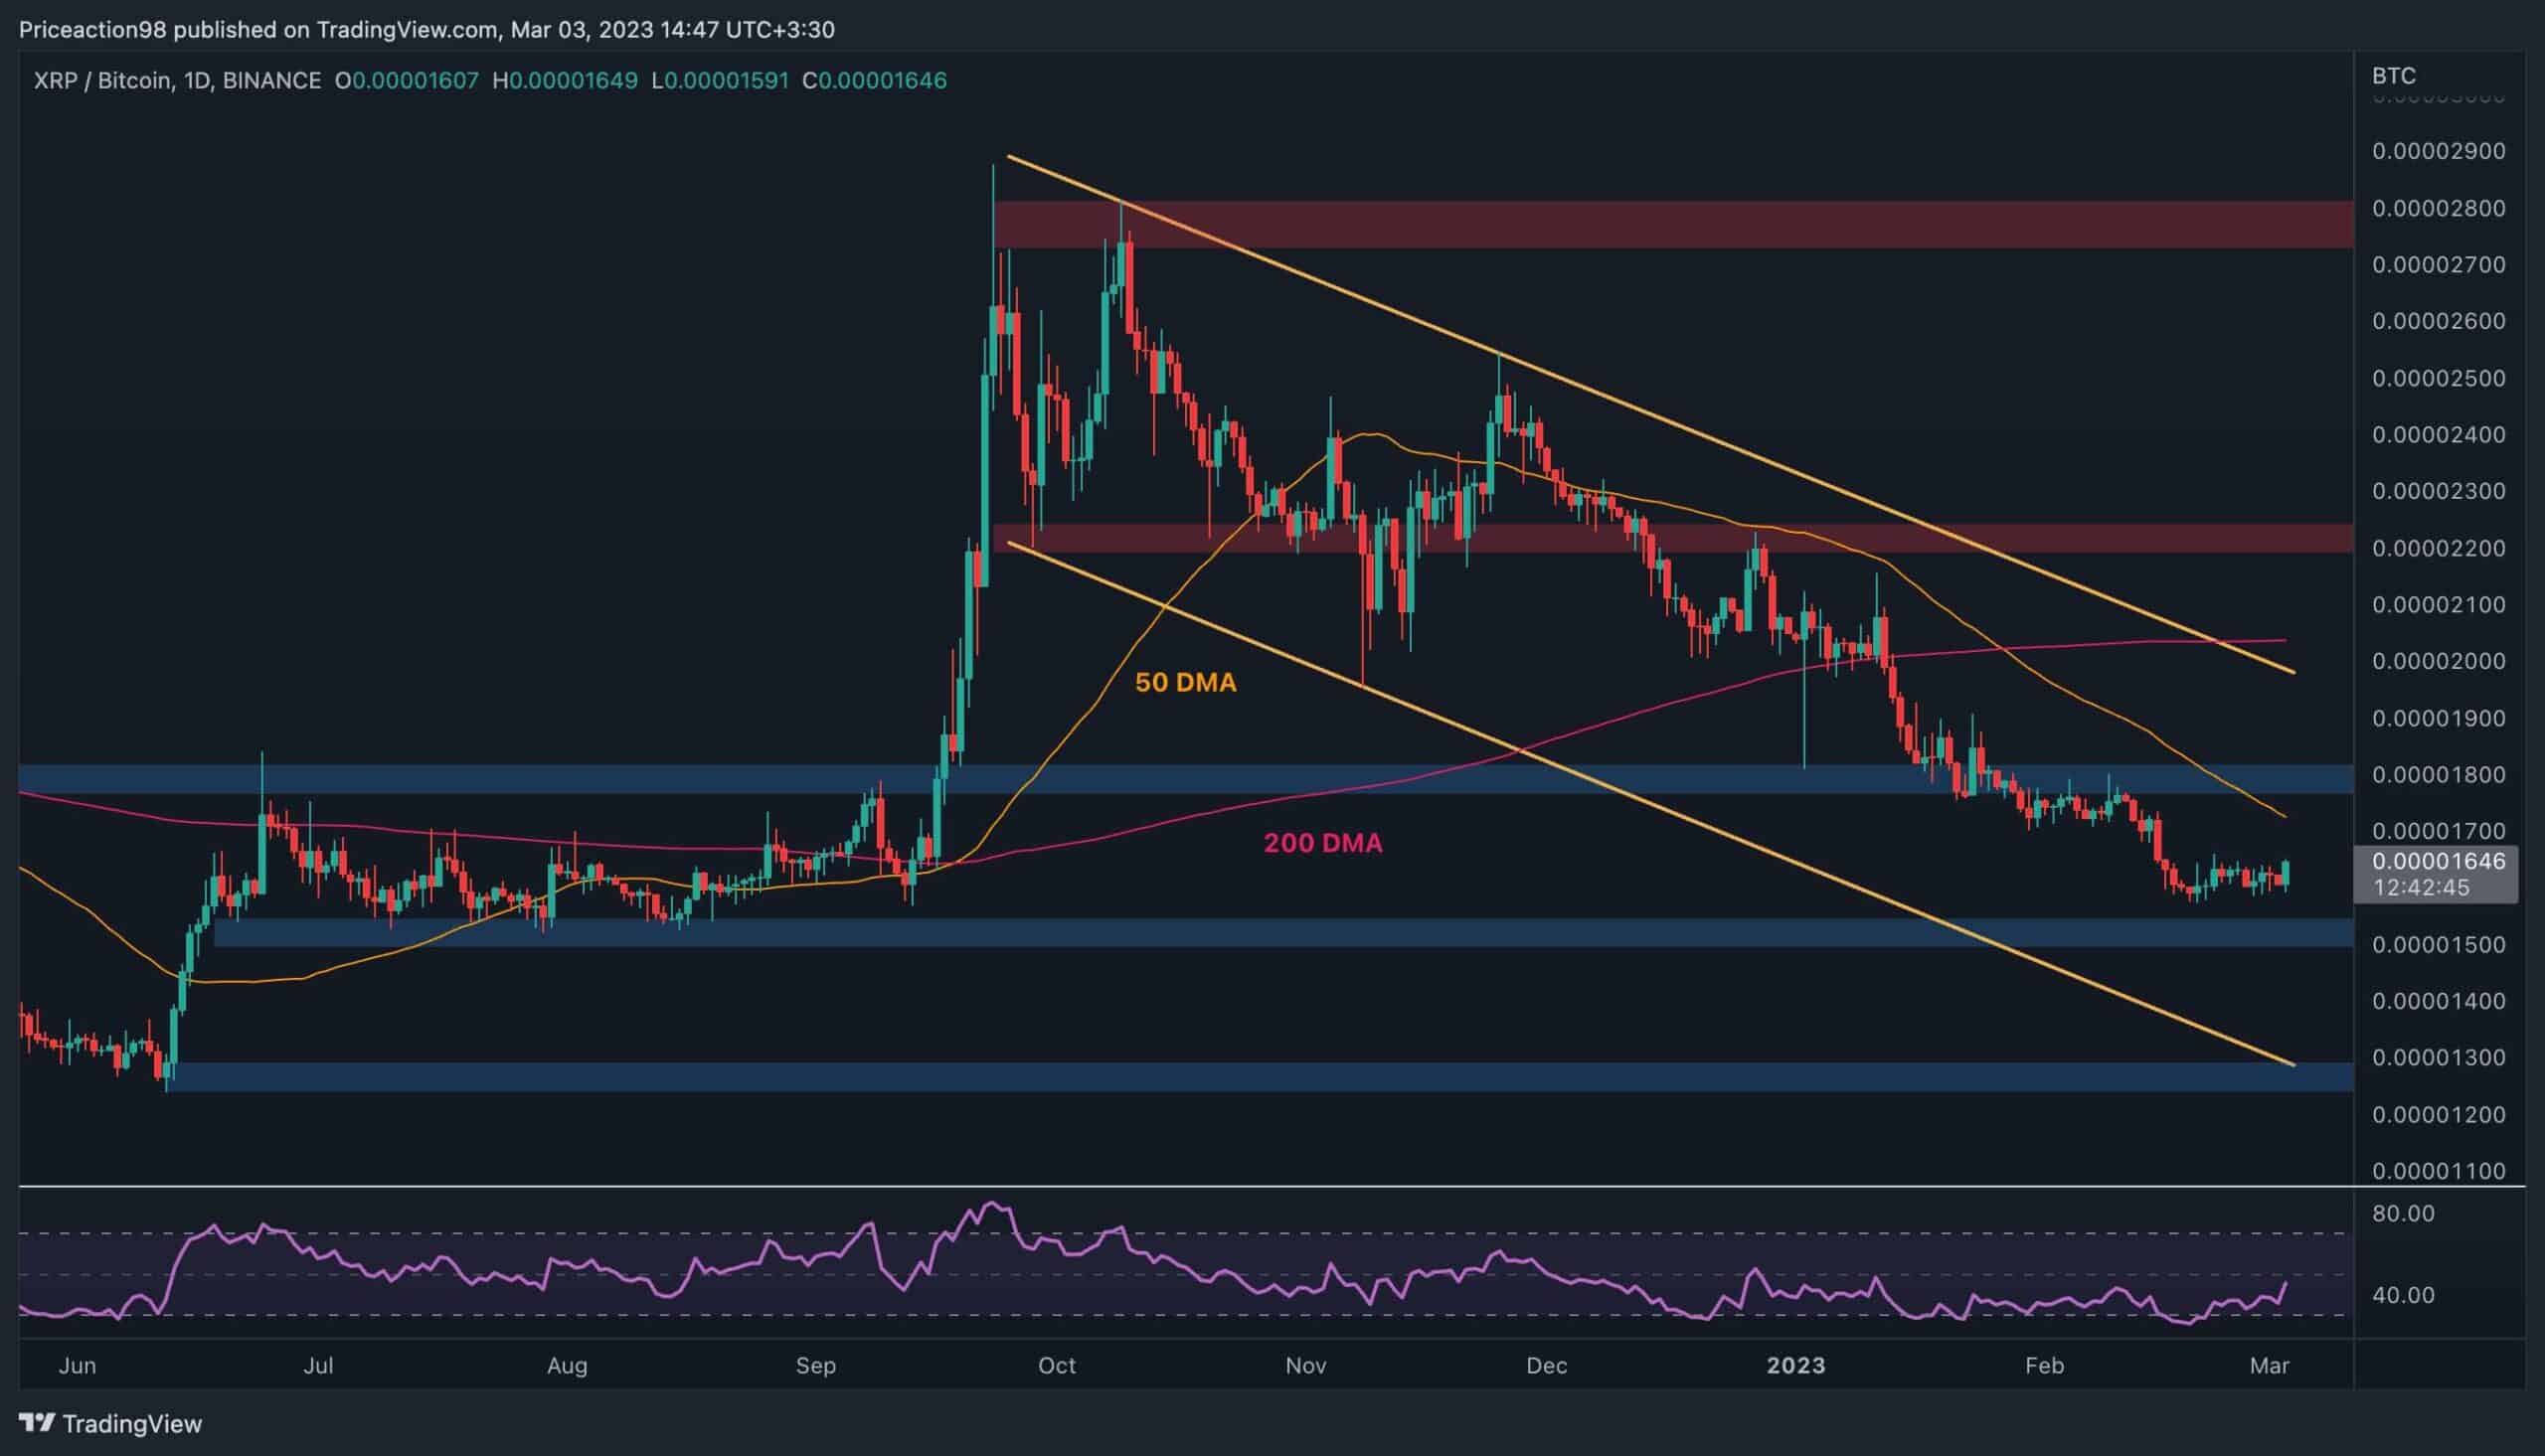
XRP/BTC Daily Chart
Against BTC, things are not looking overly optimistic either, as the market structure is clearly bearish on the daily timeframe. Despite this, the price is currently holding above the 0.000015 level, and the 50-day moving average located around the 0.000017 level could be tested in the next few days in case a rebound occurs.
The bearish price action would still be expected to continue until the 0.000018 resistance level is intact. Moreover, the RSI indicator is on the rise after exiting the oversold zone and is approaching the 50% equilibrium level.
However, with the indicator still below the mentioned threshold, the bears are still in control, and a drop toward the 0.000015 level is still highly probable in the short term.
Binance Free $100 (Exclusive): Use this link to register and receive $100 free and 10% off fees on Binance Futures first month (terms).
PrimeXBT Special Offer: Use this link to register & enter POTATO50 code to receive up to $7,000 on your deposits.
Disclaimer: Information found on CryptoPotato is those of writers quoted. It does not represent the opinions of CryptoPotato on whether to buy, sell, or hold any investments. You are advised to conduct your own research before making any investment decisions. Use provided information at your own risk. See Disclaimer for more information.
Cryptocurrency charts by TradingView.